Background
Customer churn means the loss of customers. It is the key metric to evaluate companies’ performance. Usually, the cost of retaining the old customer is lower than discovering a new customer. Therefore, to understand the reason why the customer terminates the relationship is crucial. In this assignment, I download the dataset from Kaggle. It is a bank credit card dataset. The problem is that I want to predict if the customer is going to get churned or not. If the model tells me that the customer is going to get churn, then the business department should contact the customer and provide better service in order to retain this customer. This dataset contains 10127 records and there are 23 attributes1. Some of them are categorical attributes. My objective is to predict the customer attrition. Before doing data analysis, I should get familiar with the data. Therefore, I use pandas to doing some basic math operation and get the following result:
Analysis Result
There are 8500 Existing Customer and 1627 attrition Customer in dataset. The percentage of Existing Customer is 83.93% and attrition customer is 16.07%. It indicates that this dataset is imbalance possibly. To further exploring the correlation of each features and conclude which feature has a high influence to “Attrition_Flag”, I use pandas to calculate the correlation value of each feature and sort them descending finally. But, as I describe in the above section, some of the attributes are categorical label. I cannot do mathematic operation to them unless I transform them to numeric value. Fortunately, preprocessing module of “sklearn” library provides a help class “LabelEncoder” which can transform the categorical value to numeric value. However, it has side effect that the categorical value has a numeric intention after transformation. It might affect the prediction result negatively or positively. After the transformation and correlation calculation, I find that except the “naïve_bayes_mon_1 and 2” attributes, the “Total_Trans_Ct is the top positive attribute to and “contact_count_12_mon is the top negative attribute to customer attrition. In addition, I visualize the correlation by heatmap and found that “Avg_Open_To_Buy” attribution has the high correlation with” Credit_Limit”. Thus, I drop it before to avoid overfitting. All the visualization result I will show you at the following parts.
Prediction and Visualization
In the prediction part, I tried a different classifier model to predict the customer attrition. Decision Tree, Random Forest, Gradient Boosting get a good score on this predict but SVM and K Neighbors get a worse score. I use the “sklearn” library to plot each model’s confusion matrix to visualize the result.
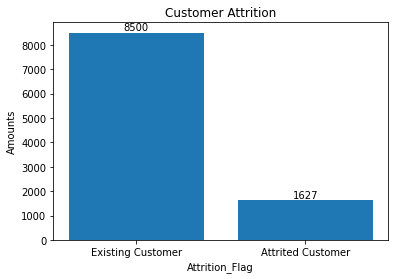
Customer attrition Distribution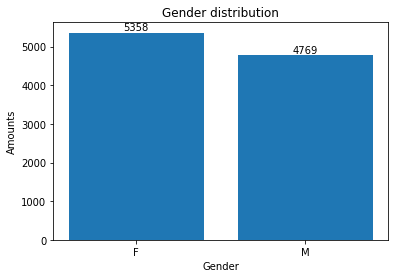
Gender Distribution 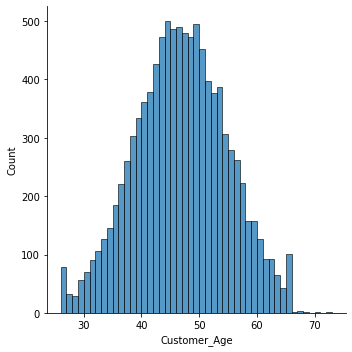
Age Distribution
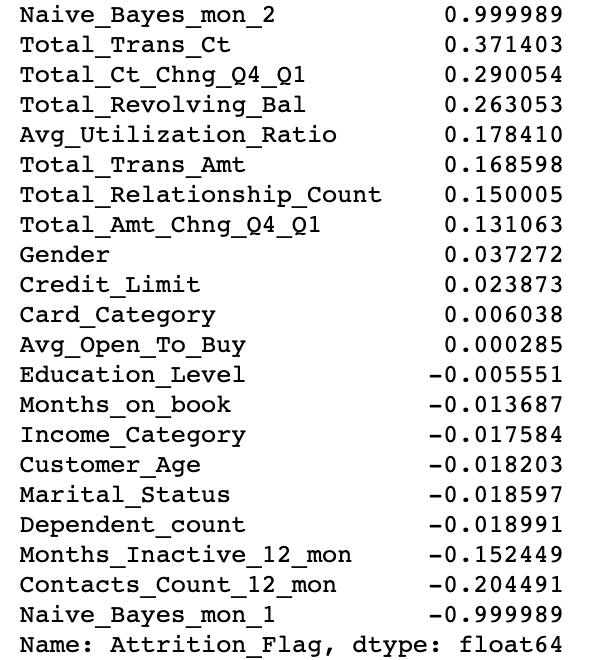
Feature Correlation with Attrition_Flag
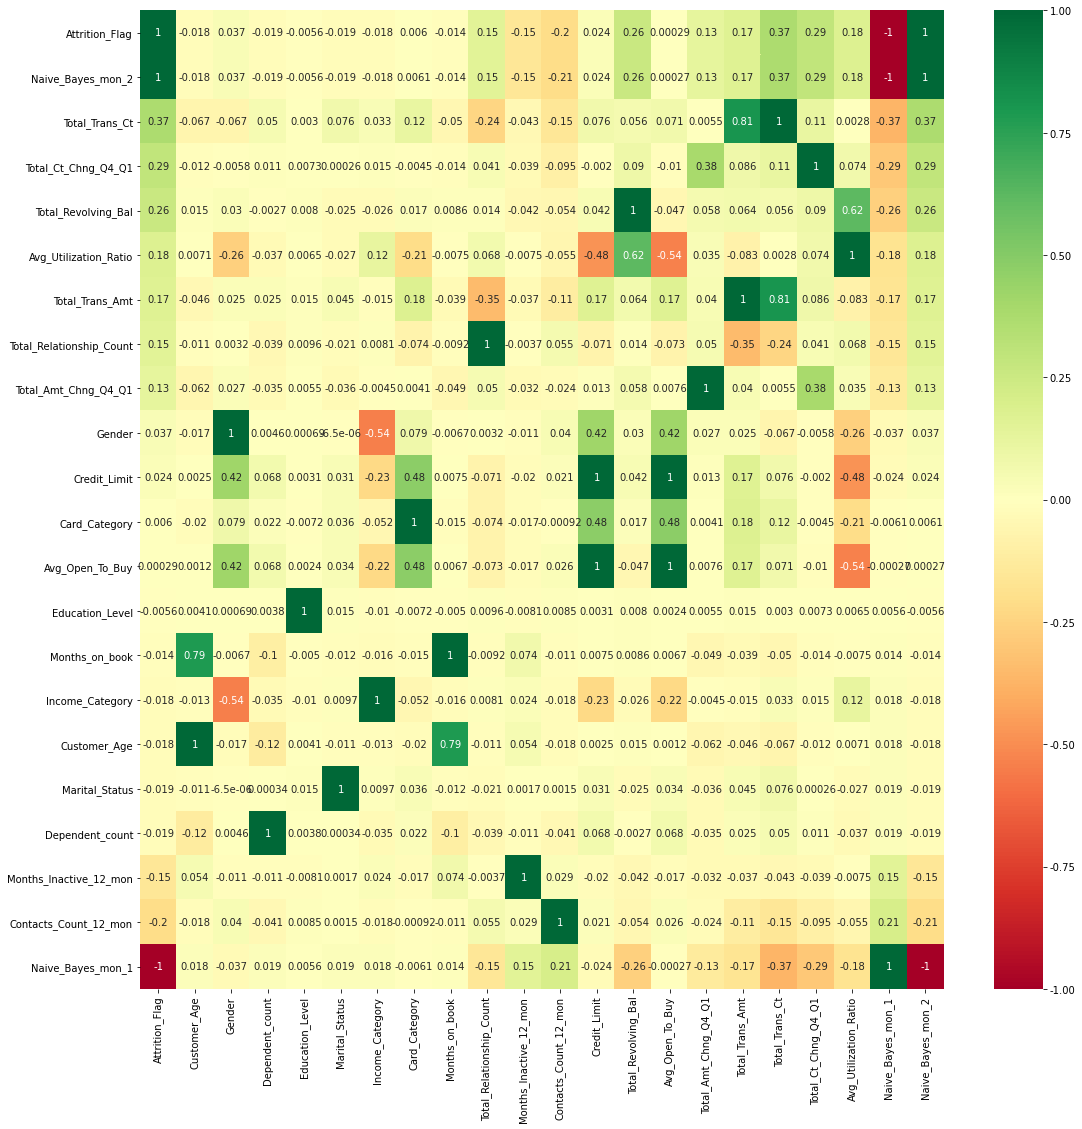 Features Heat map
Attrition_Flag value is 1 means Existing Customer and 0 means Attrited Customer
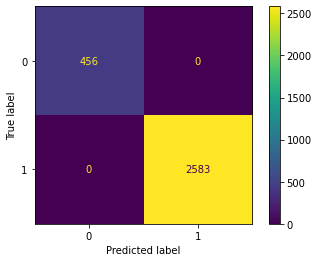
Decision Tree, Random Forest and Gradient Boosting Confusion Matrix
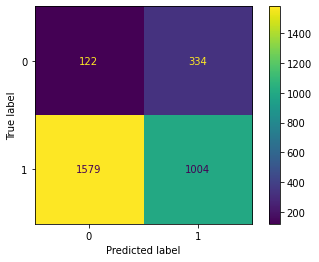
SVM Confusion Matrix
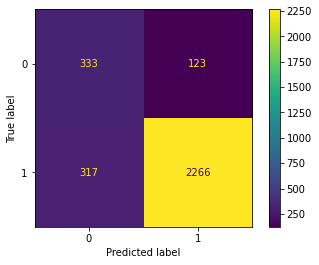
K Neighbors Confusion Matrix
Conclusion
Customer attrition is one of the important metrics to evaluate the company year performance and justify their sustainability. Decision Tree, Random Forest and Gradient Boosting algorithm have good performance on this dataset. However, this dataset is an imbalance dataset. The score of evaluating new records may be under test performance slightly.
For your Reference
Please leave your email below.